Objetivo:
Desenvolver uma representação visual de diferentes conjuntos de cervejas em um período de 9 semanas, incluindo o estudo da história da cerveja e as características essenciais para uma compreensão completa.
Objective:
To create a visualization of beer sets within a 9-week timeframe, including a study of beer history and the necessary features for understanding.
Pesquisa das cervejarias no Brasil:
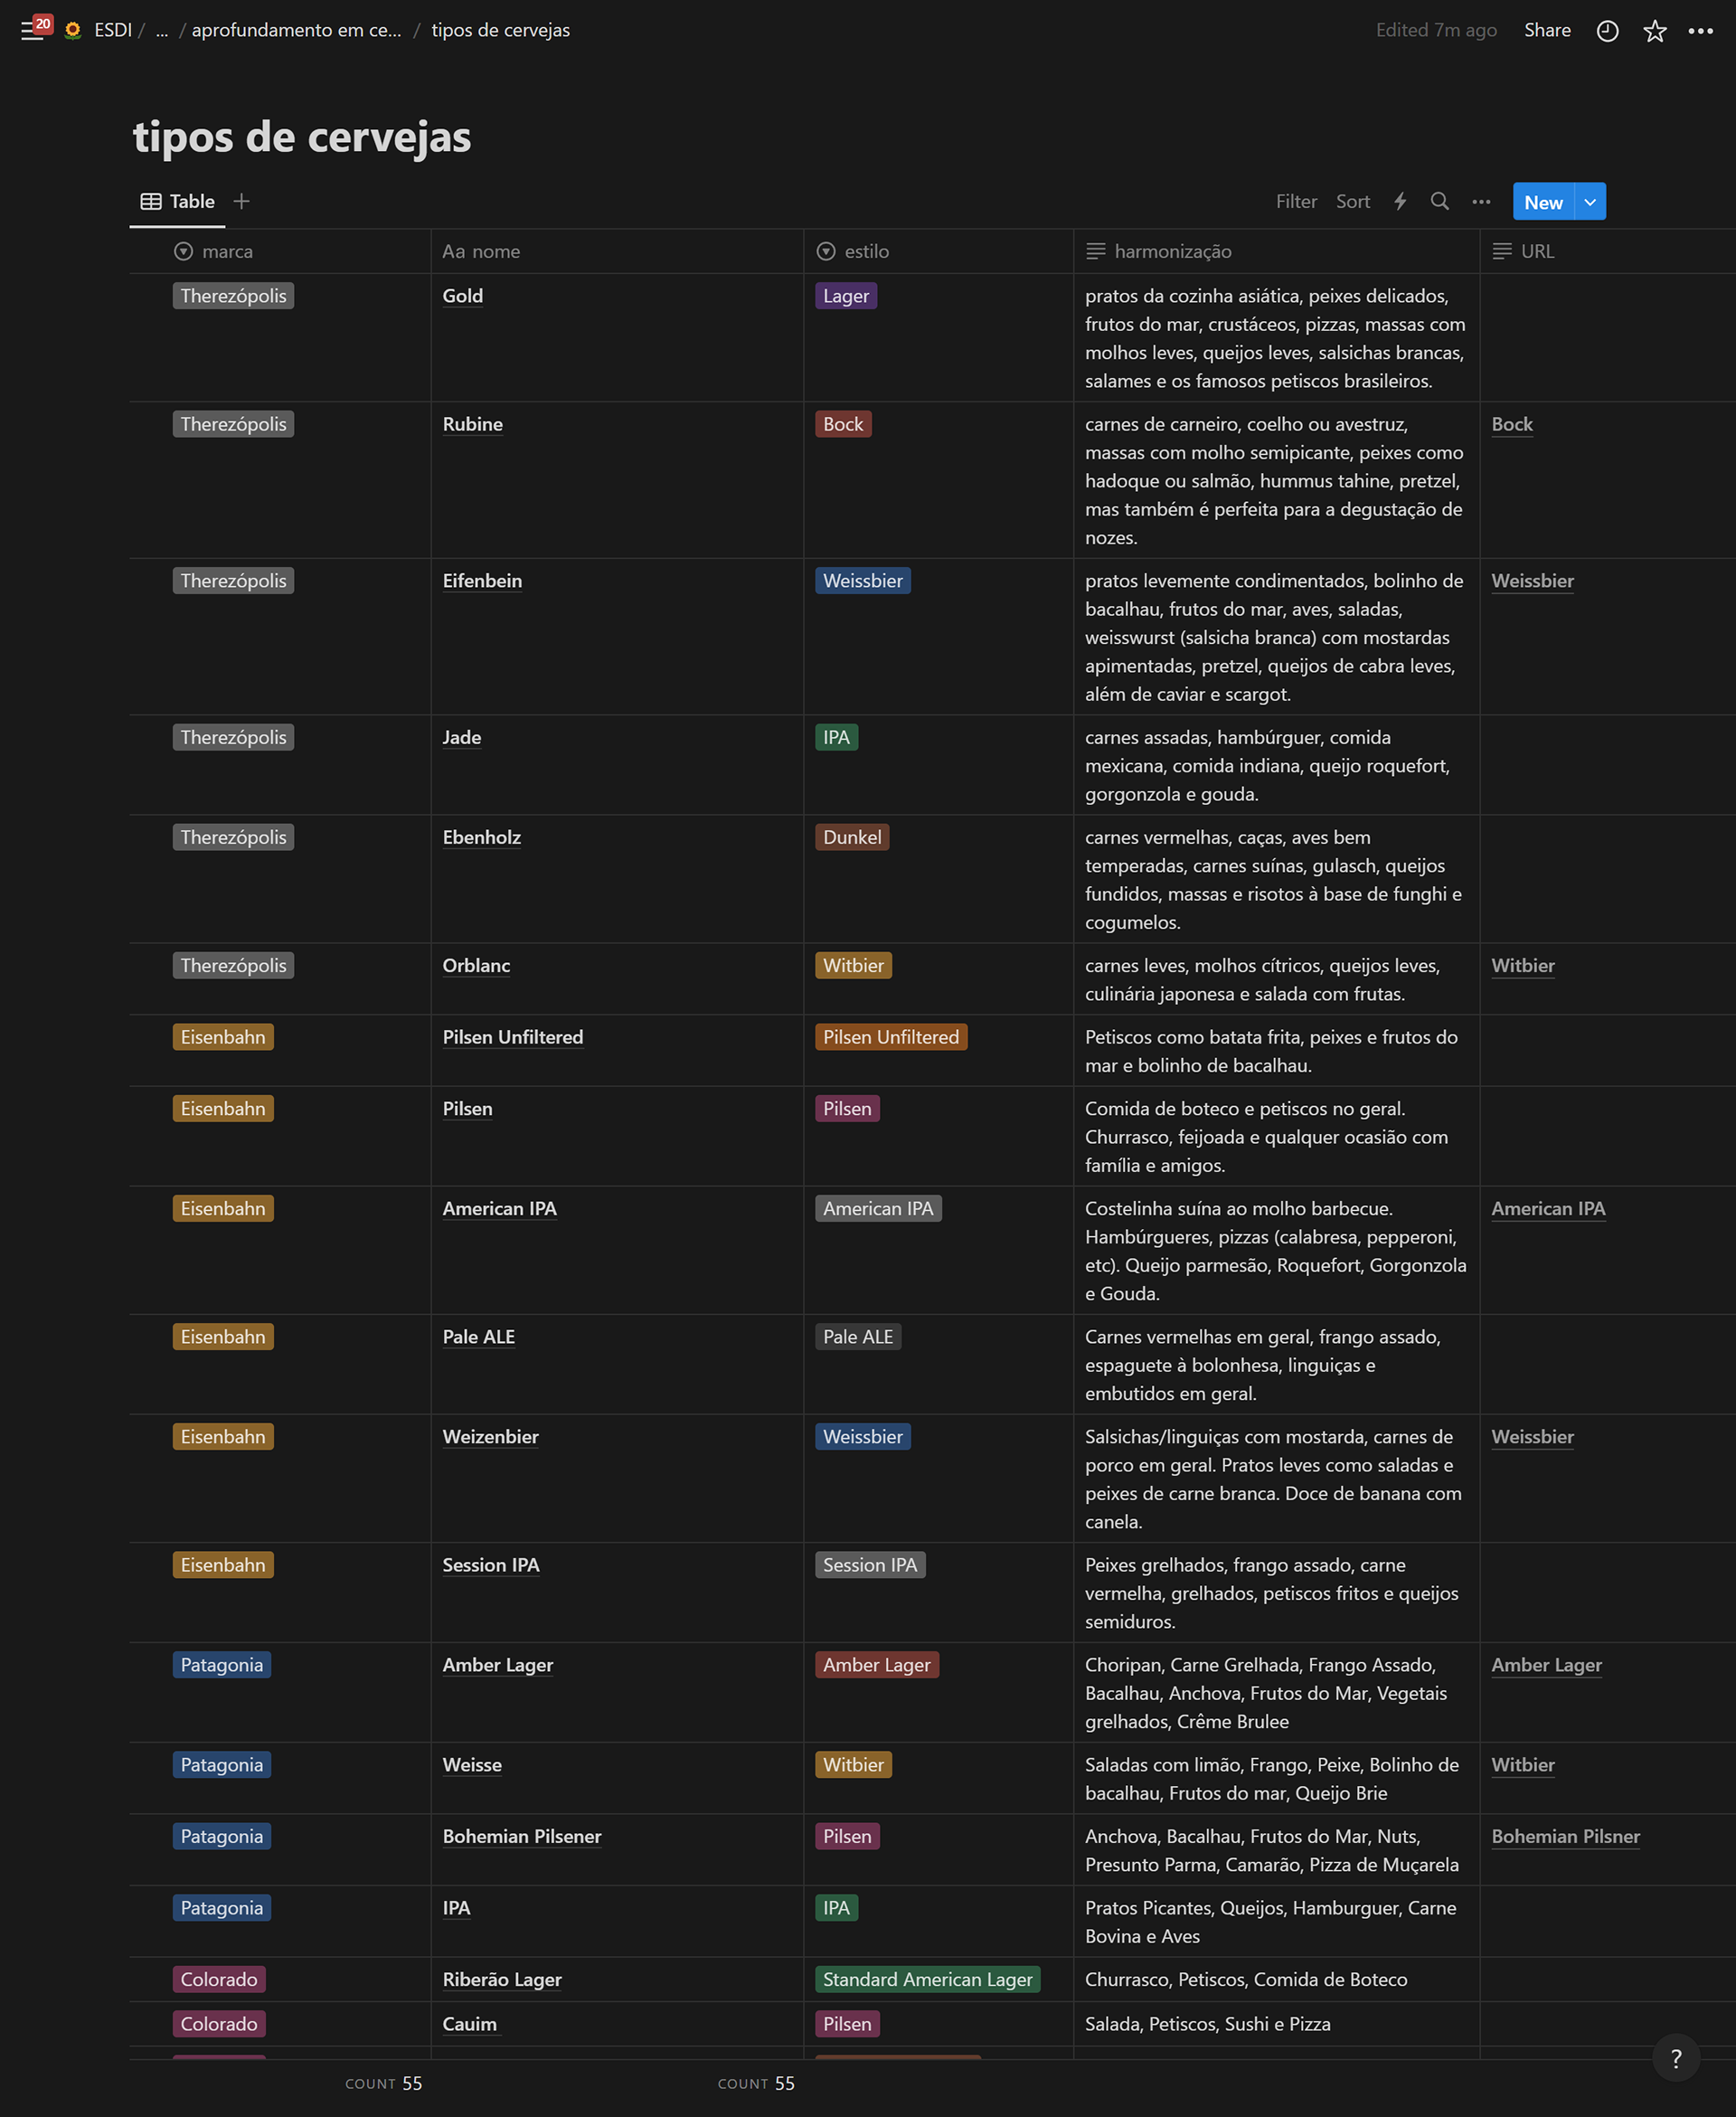
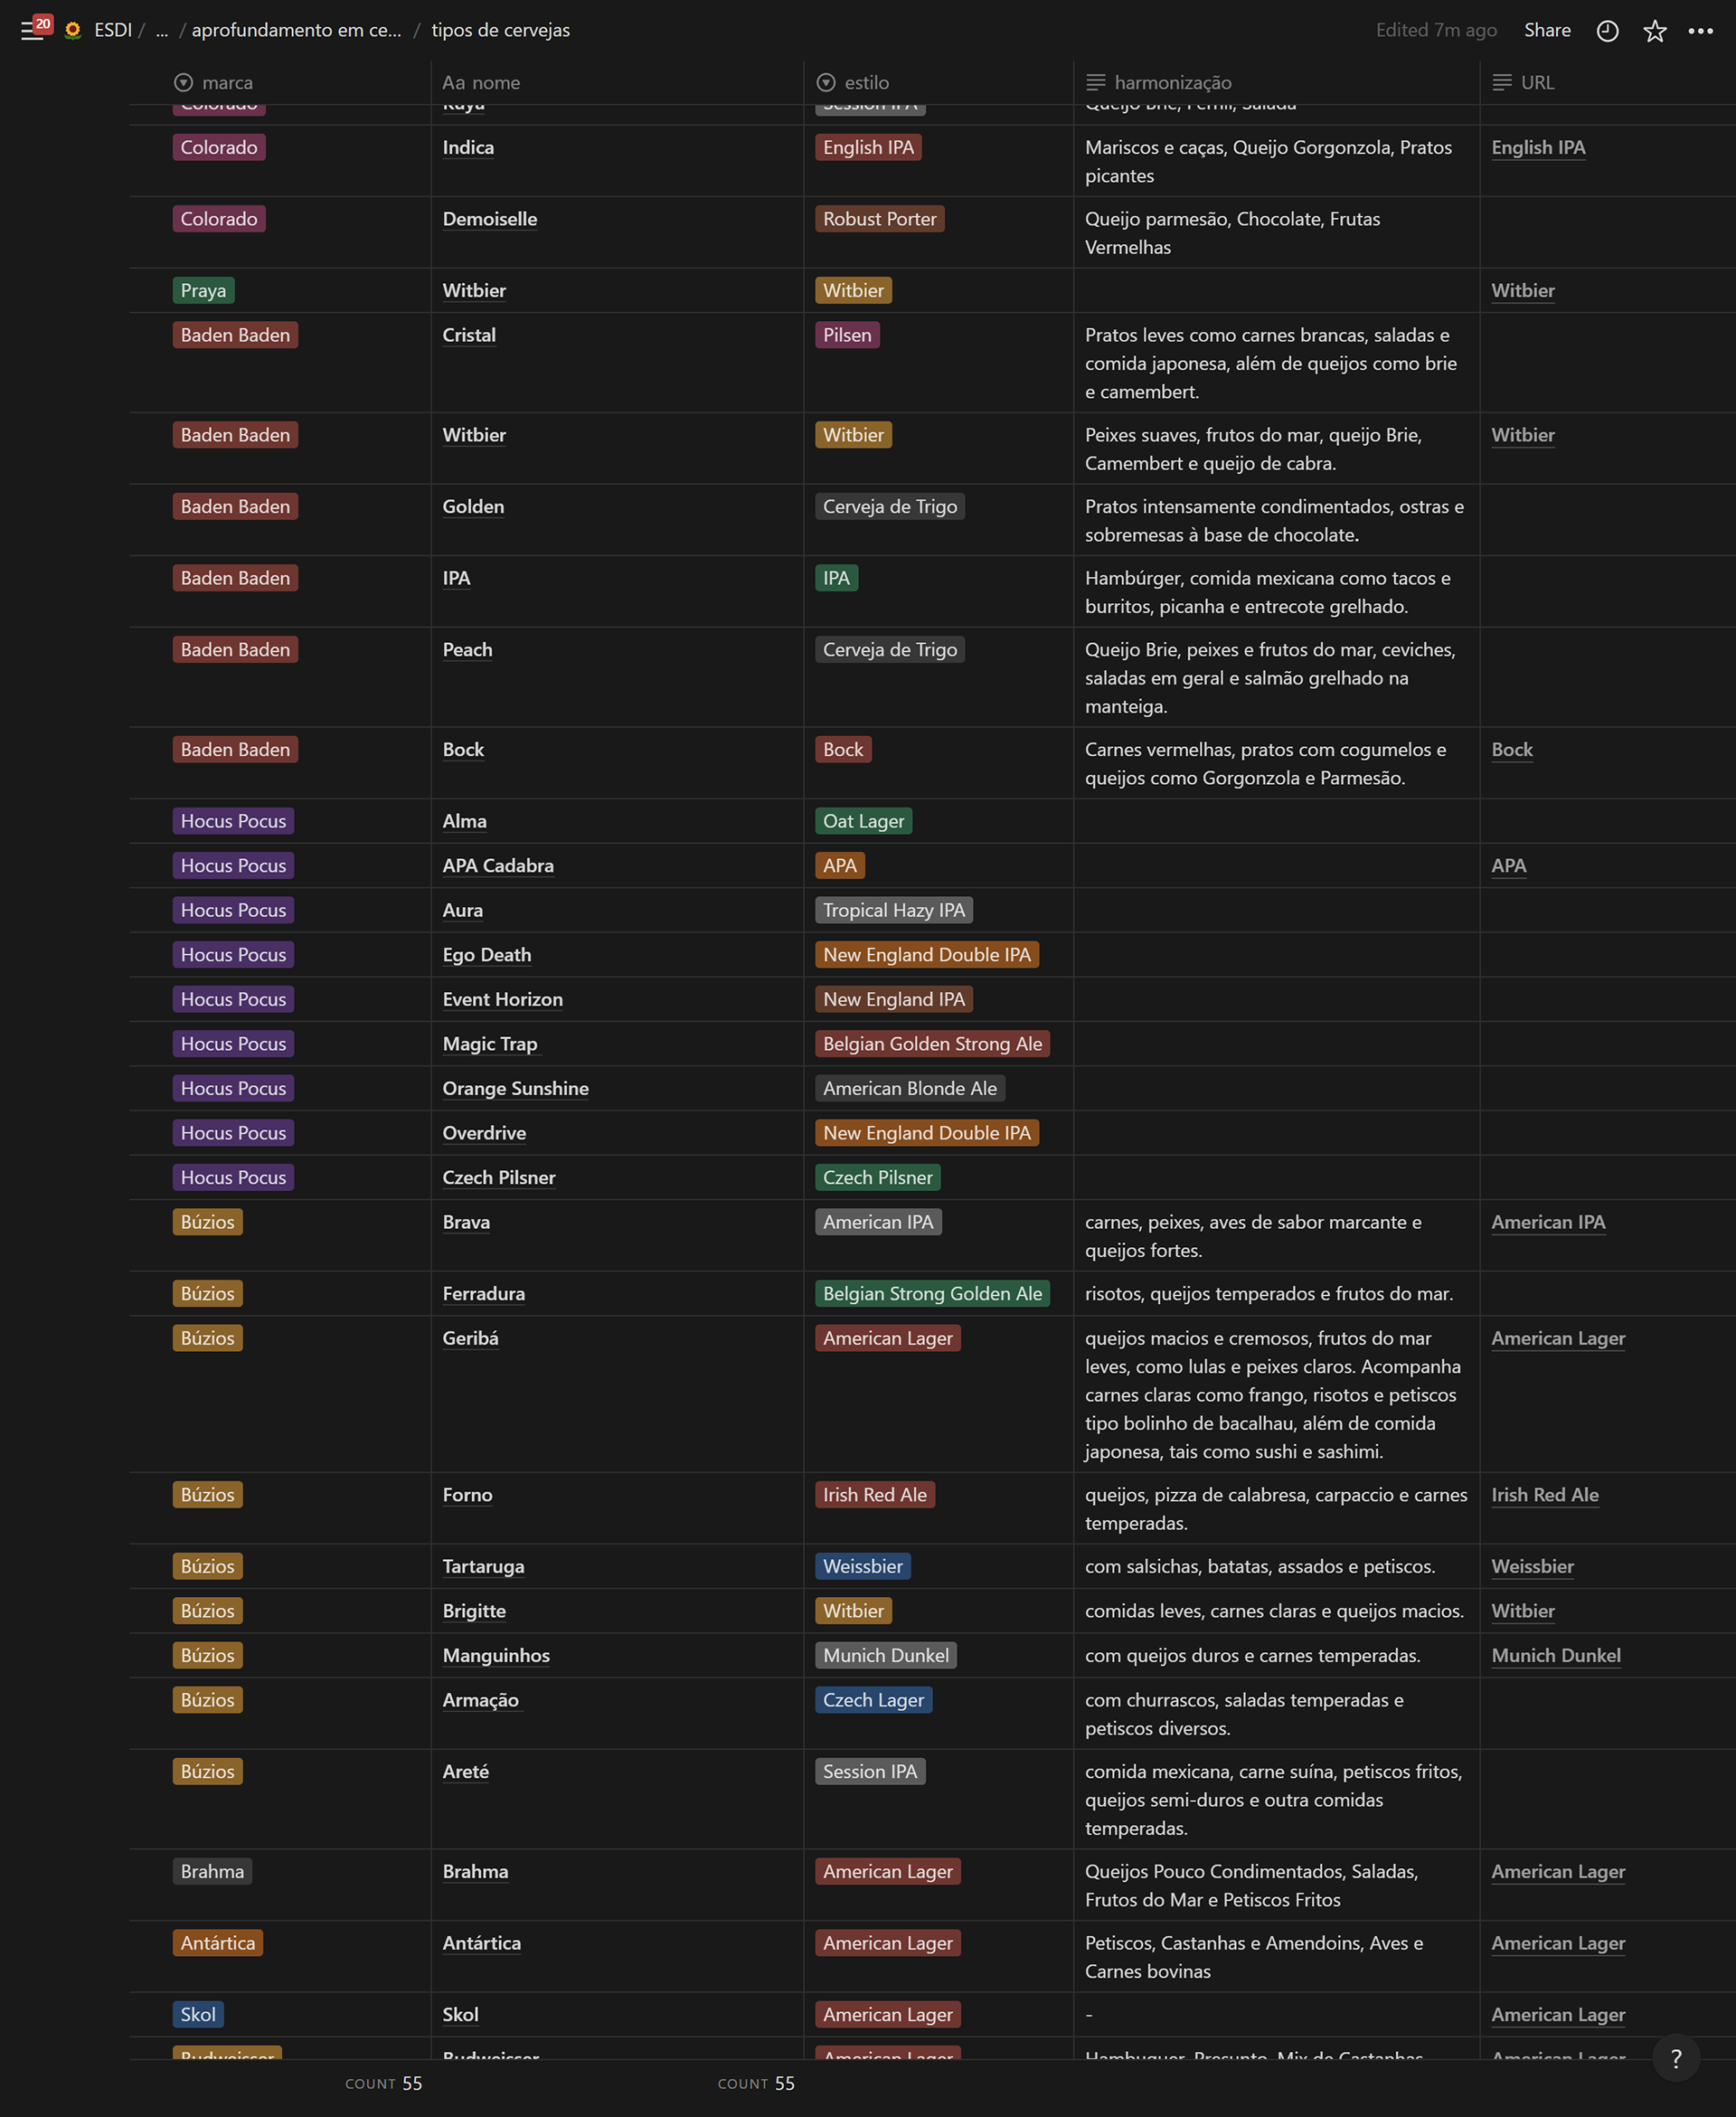
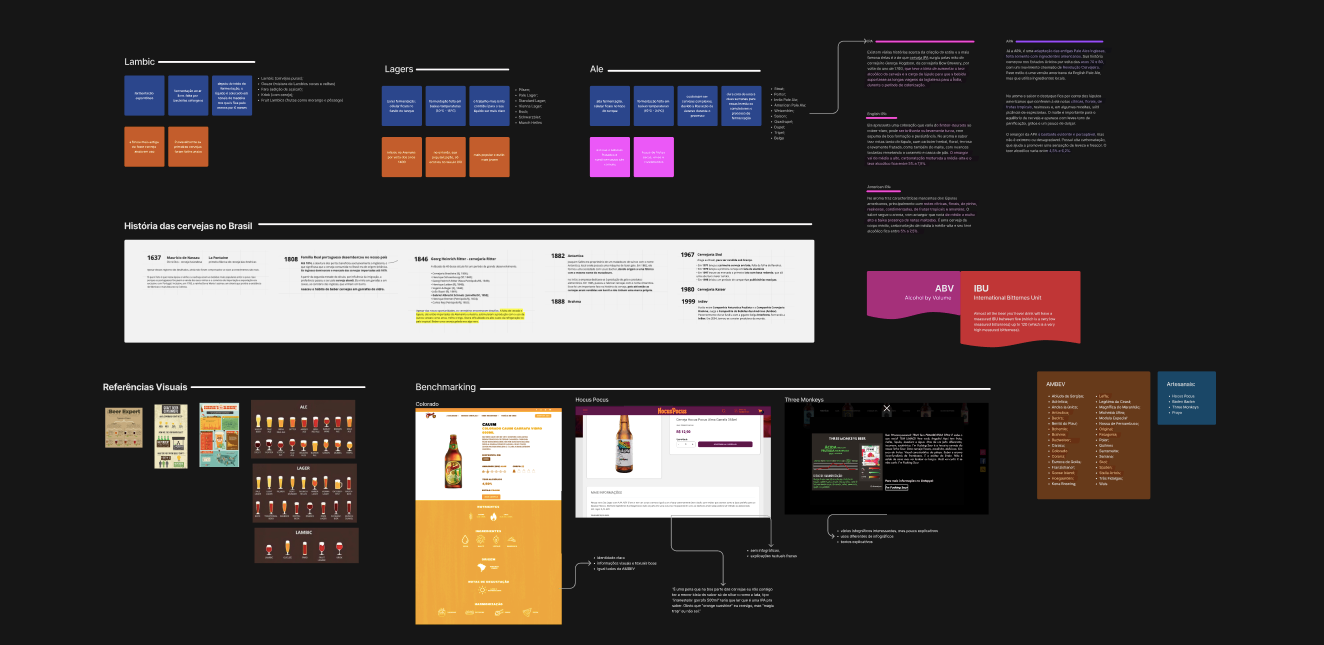
Foram selecionadas as 16 maiores cervejarias no Brasil, e cada uma das suas cervejas foi categorizada por: marca, nome, estilo e harmonização. Reunimos mais de 55 cerveja. Além disso, foi feita uma pesquisa para entendermos as características, as divisões e a história da cerveja. Todo o processo foi documentado pelo Notion e pelo Miro.
Research on breweries in Brazil:
We selected the 16 largest breweries in Brazil, and each of their beers was categorized by brand, name, style, and pairing. We gathered over 55 beers. Additionally, research was conducted to understand the characteristics, classifications, and history of beer. The entire process was documented using Notion and Miro.
Entrevistas:
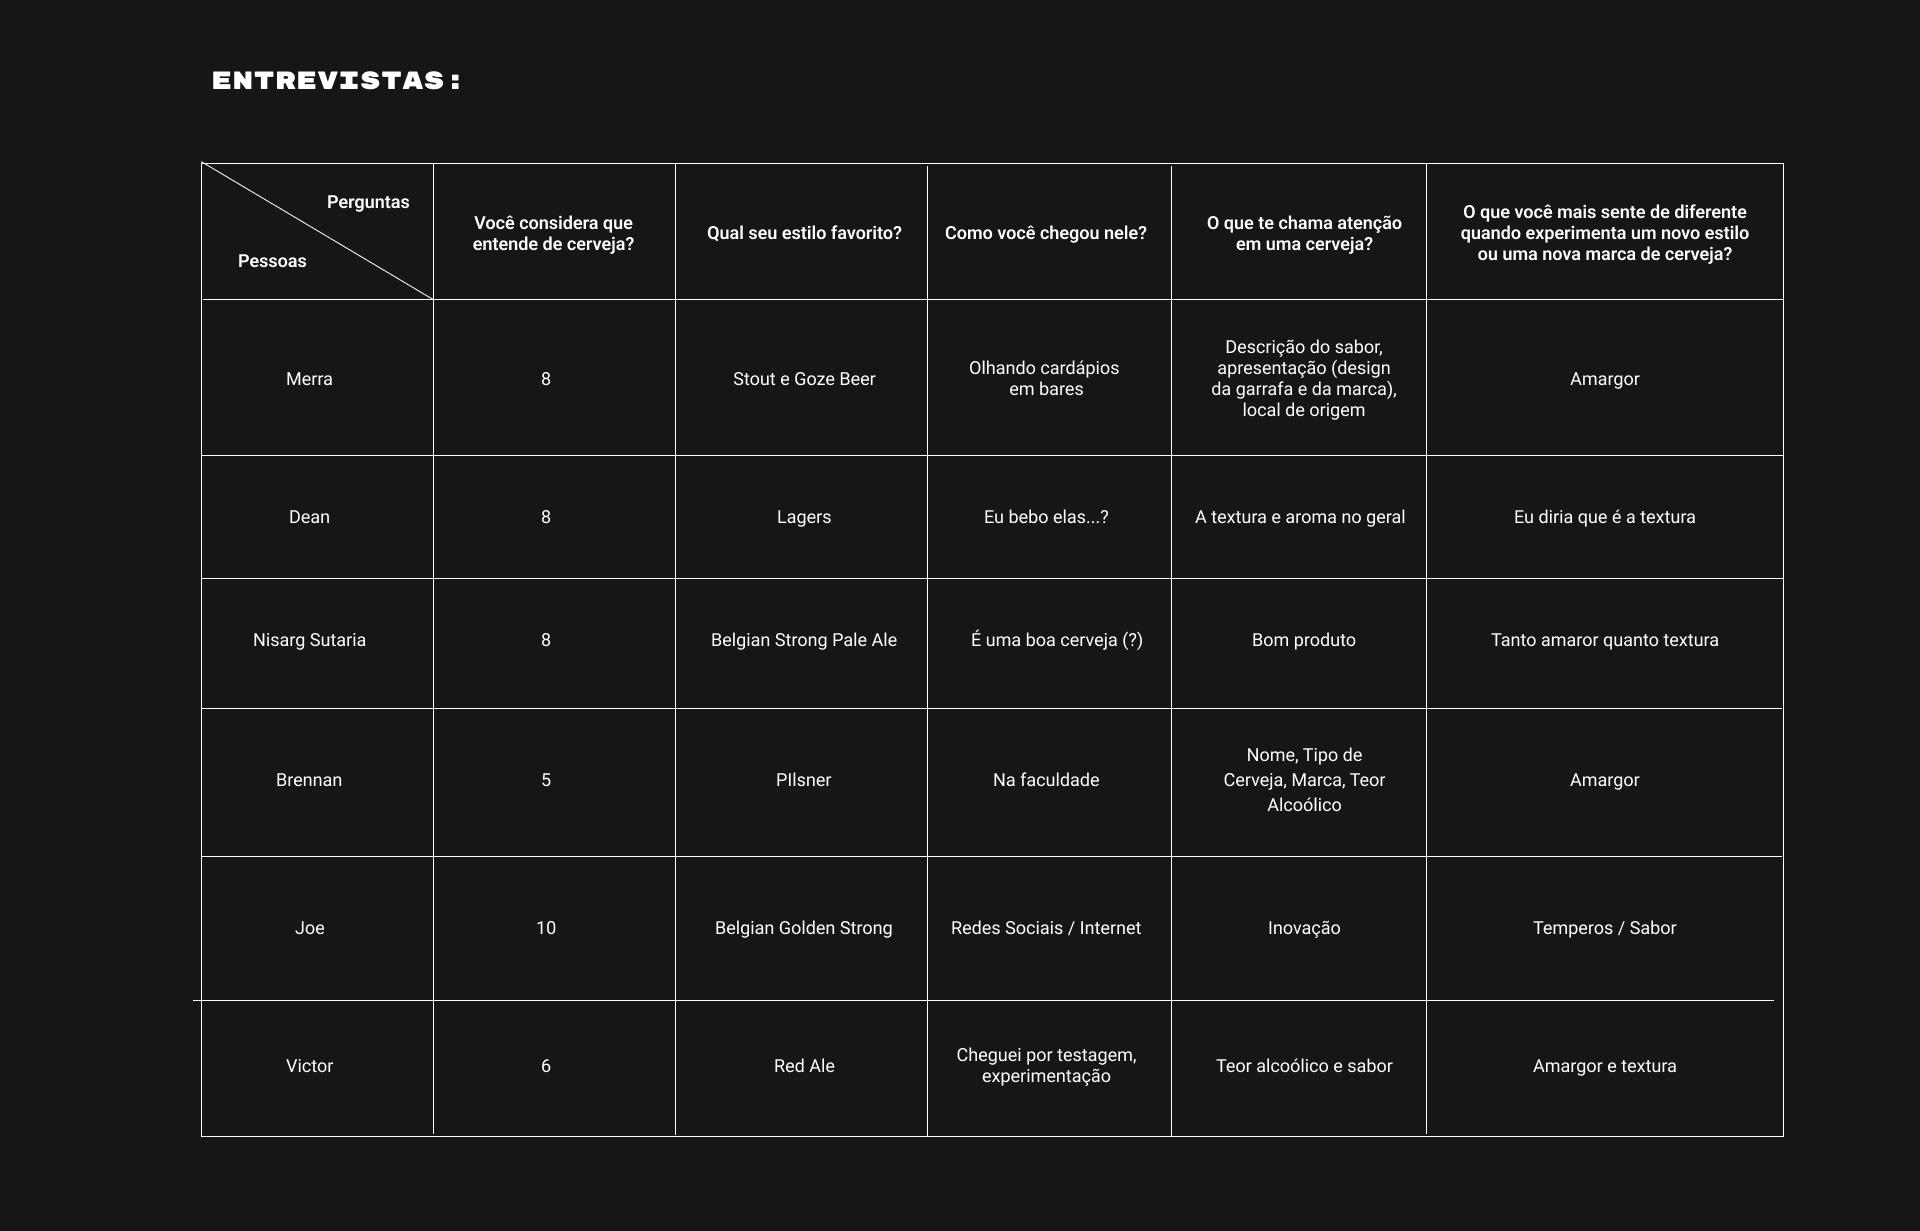
Para conversar com pessoas que possuem um conhecimento prévio sobre cervejas, foram realizadas seis entrevistas online através das plataformas Reddit e Discord.
Interviews
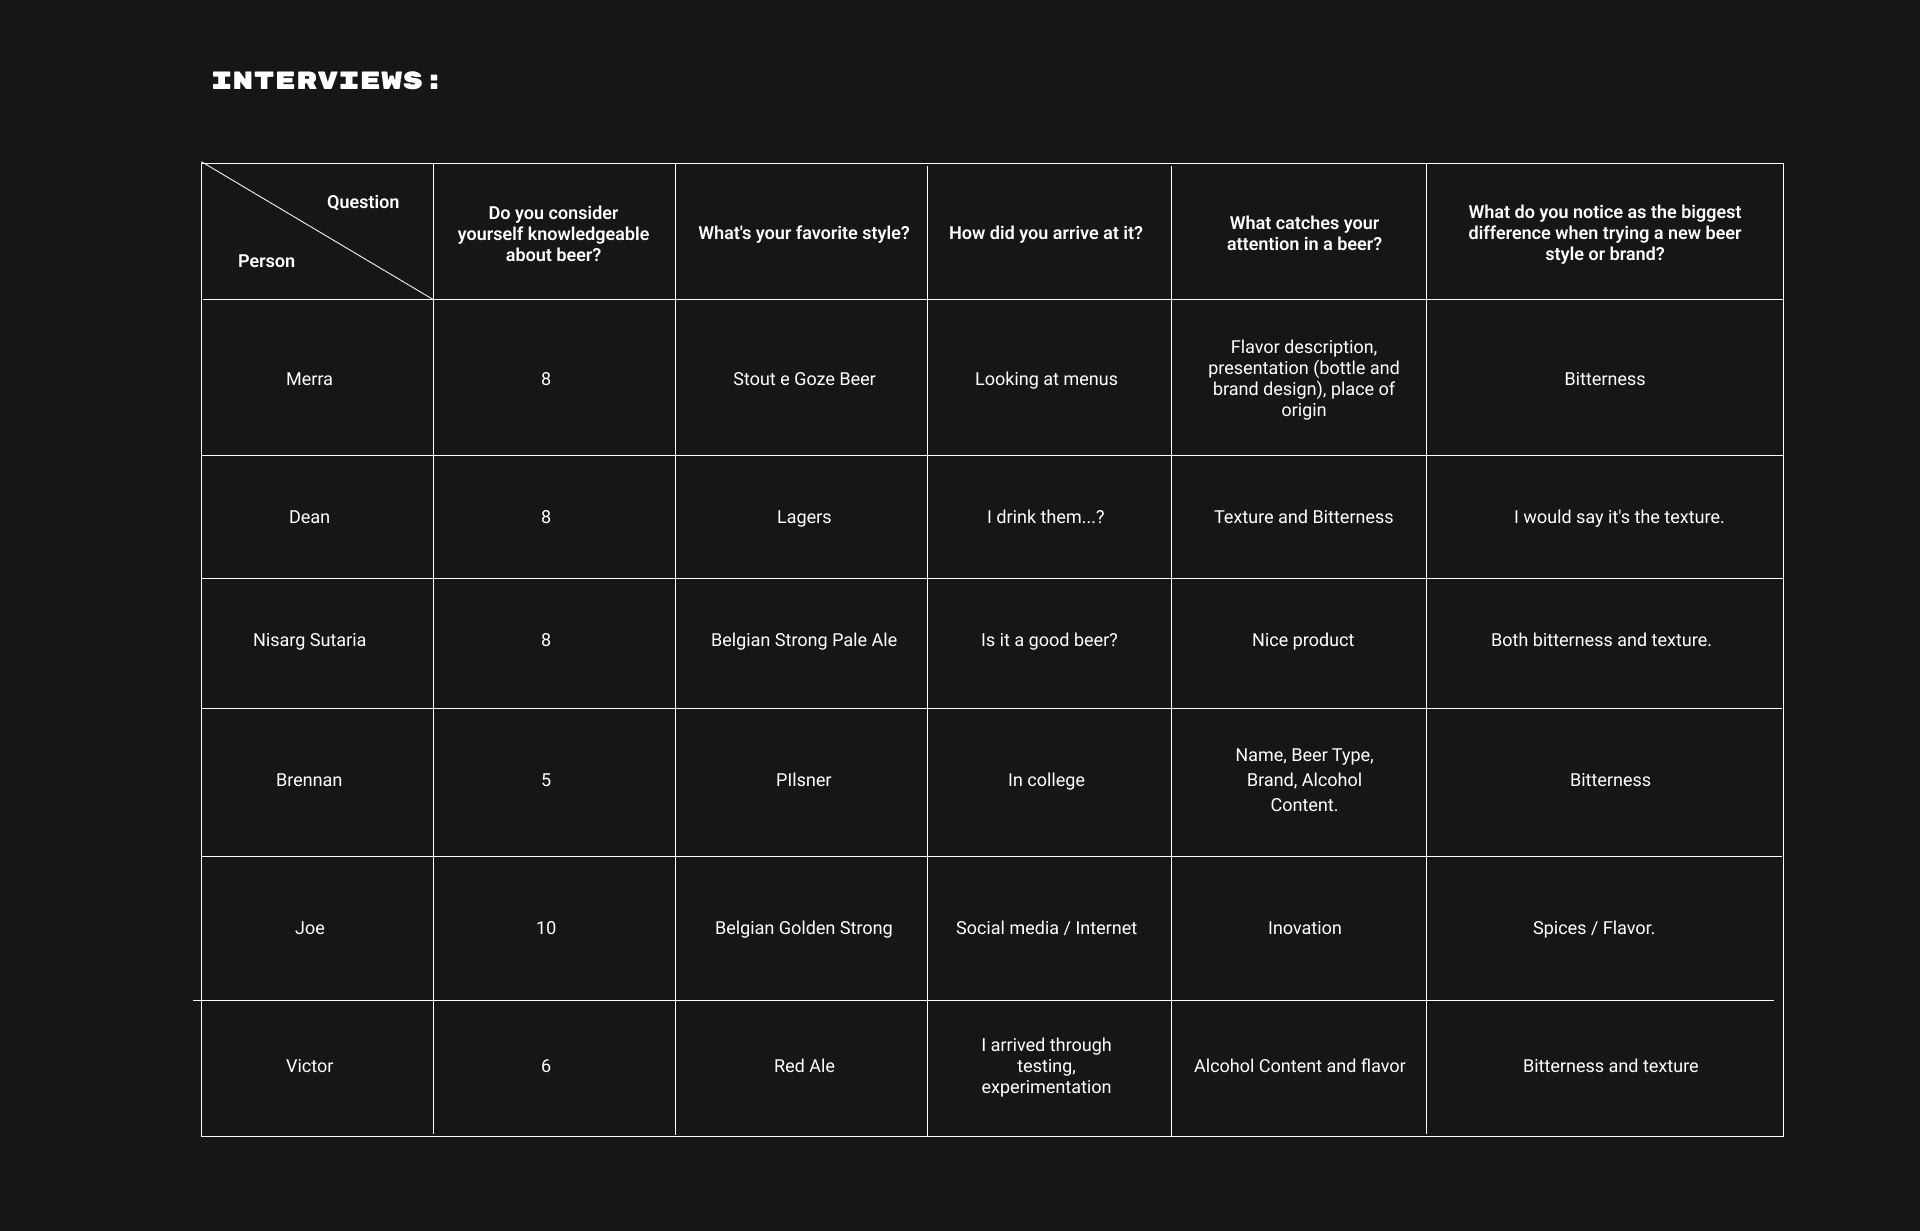
In order to engage with individuals who have prior knowledge of beers, six online interviews were conducted using the Reddit and Discord platforms.
Primeiros Testes:
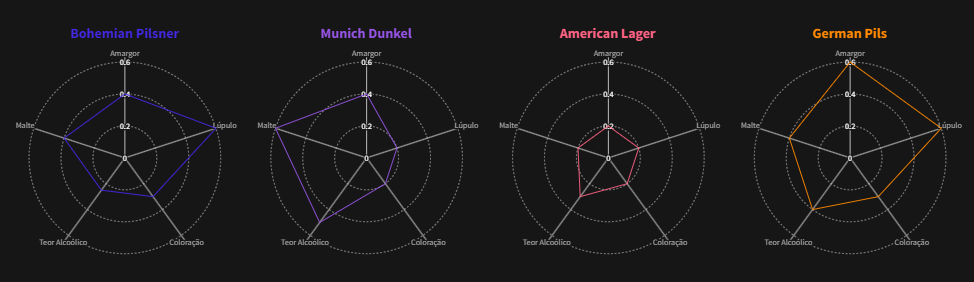
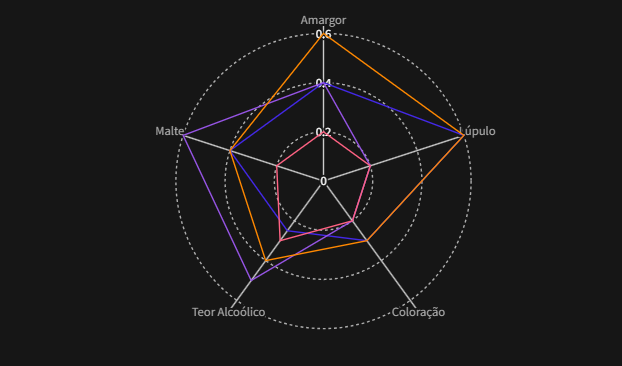
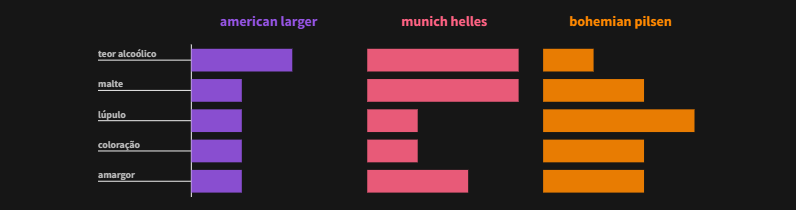
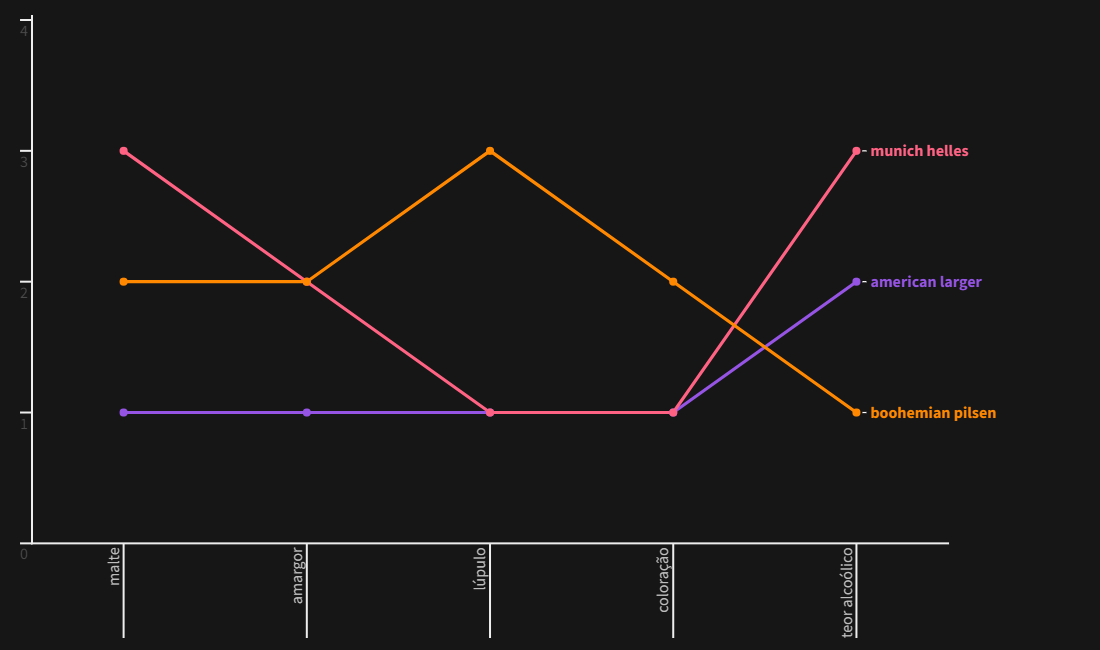
Após a leitura do Storytelling com Dados da Cole Nussbaumer Knaflic, realizamos os primeiros testes, utilizando a ferramenta Flourish. No geral, o resultado não agradou, pela falta de flexibilidade da ferramenta. Apesar de trazer muitas possibilidades de experimentação, precisávamos de mais controle nas formatações.
Initial tests:
After reading 'Storytelling with Data' by Cole Nussbaumer Knaflic, we conducted our initial tests, using the Flourish tool. Overall, the results were unsatisfactory due to the tool's lack of flexibility. While it offered many experimentation possibilities, we found that we needed more control over the formatting.
Design System e Identidade Visual:
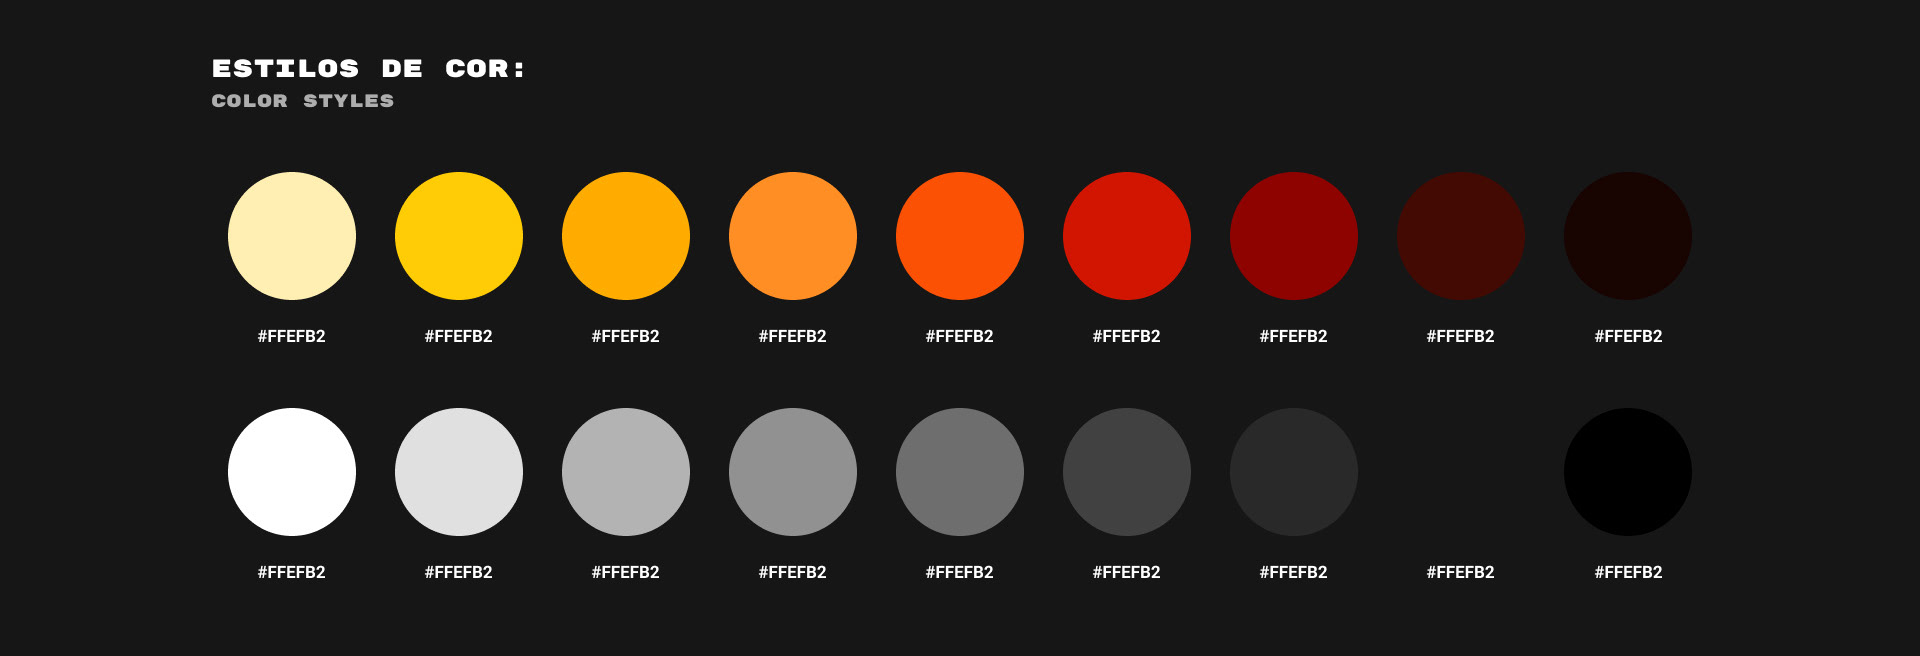
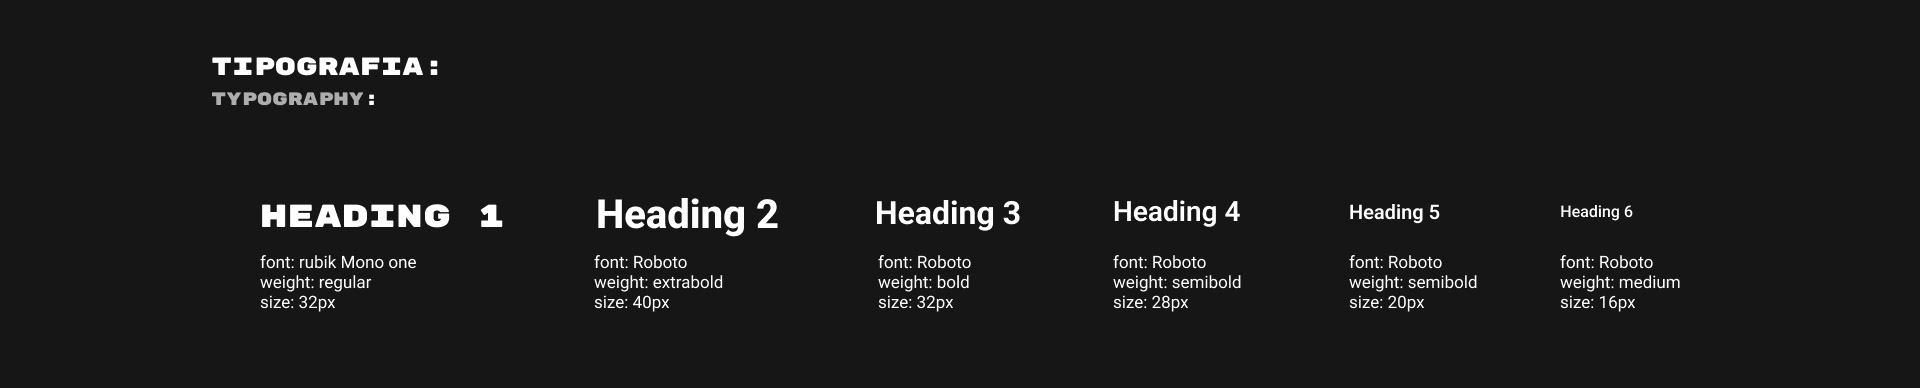
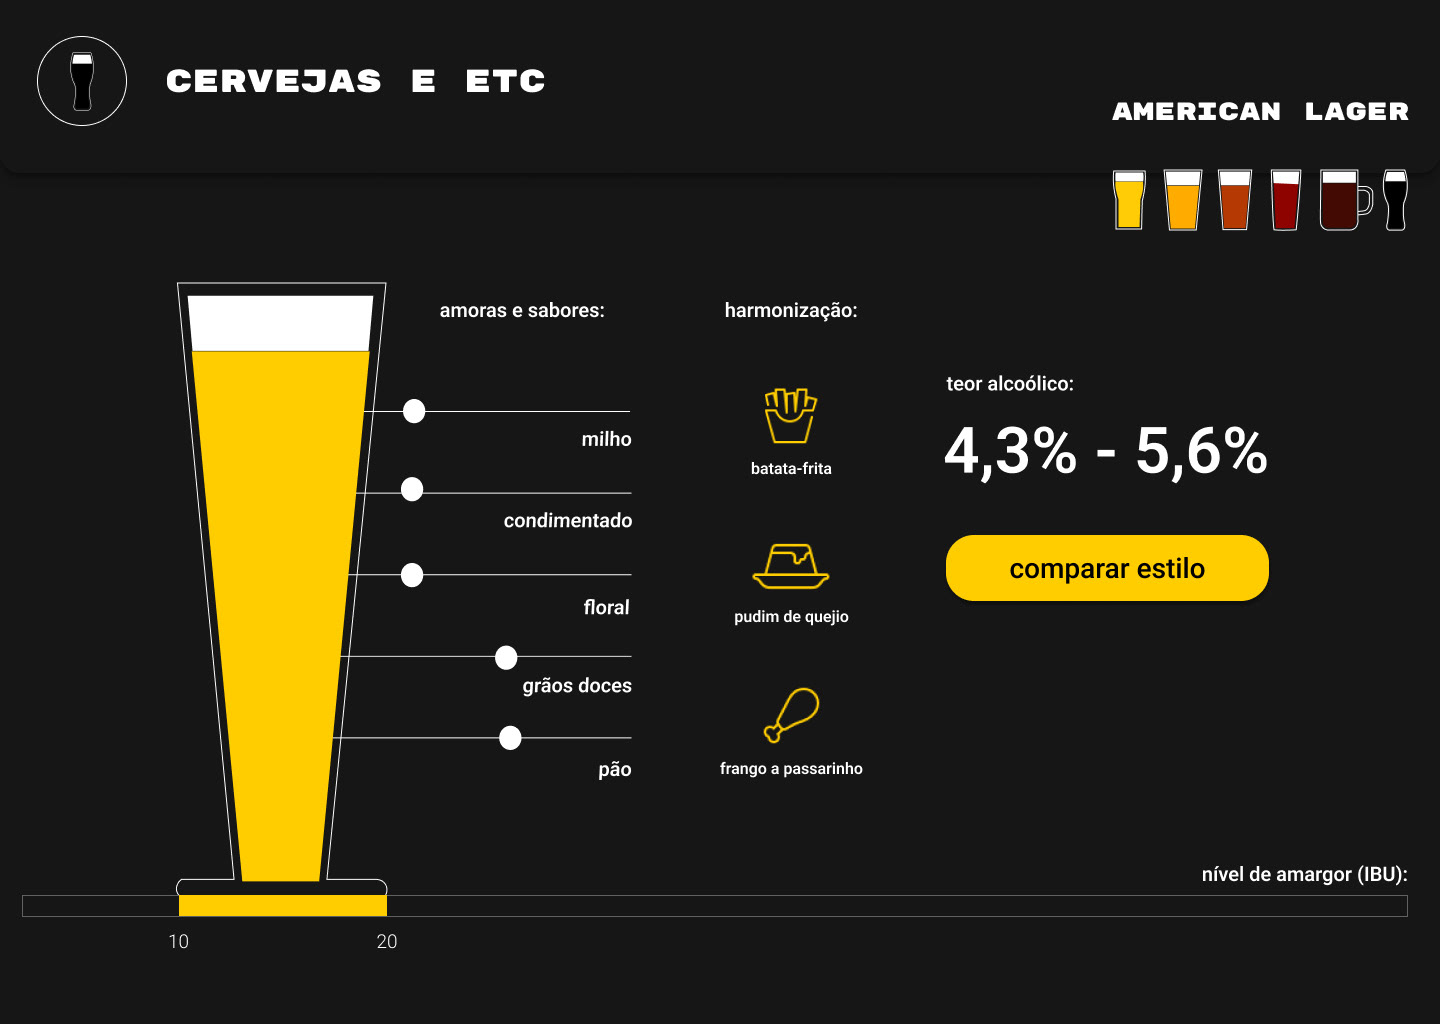
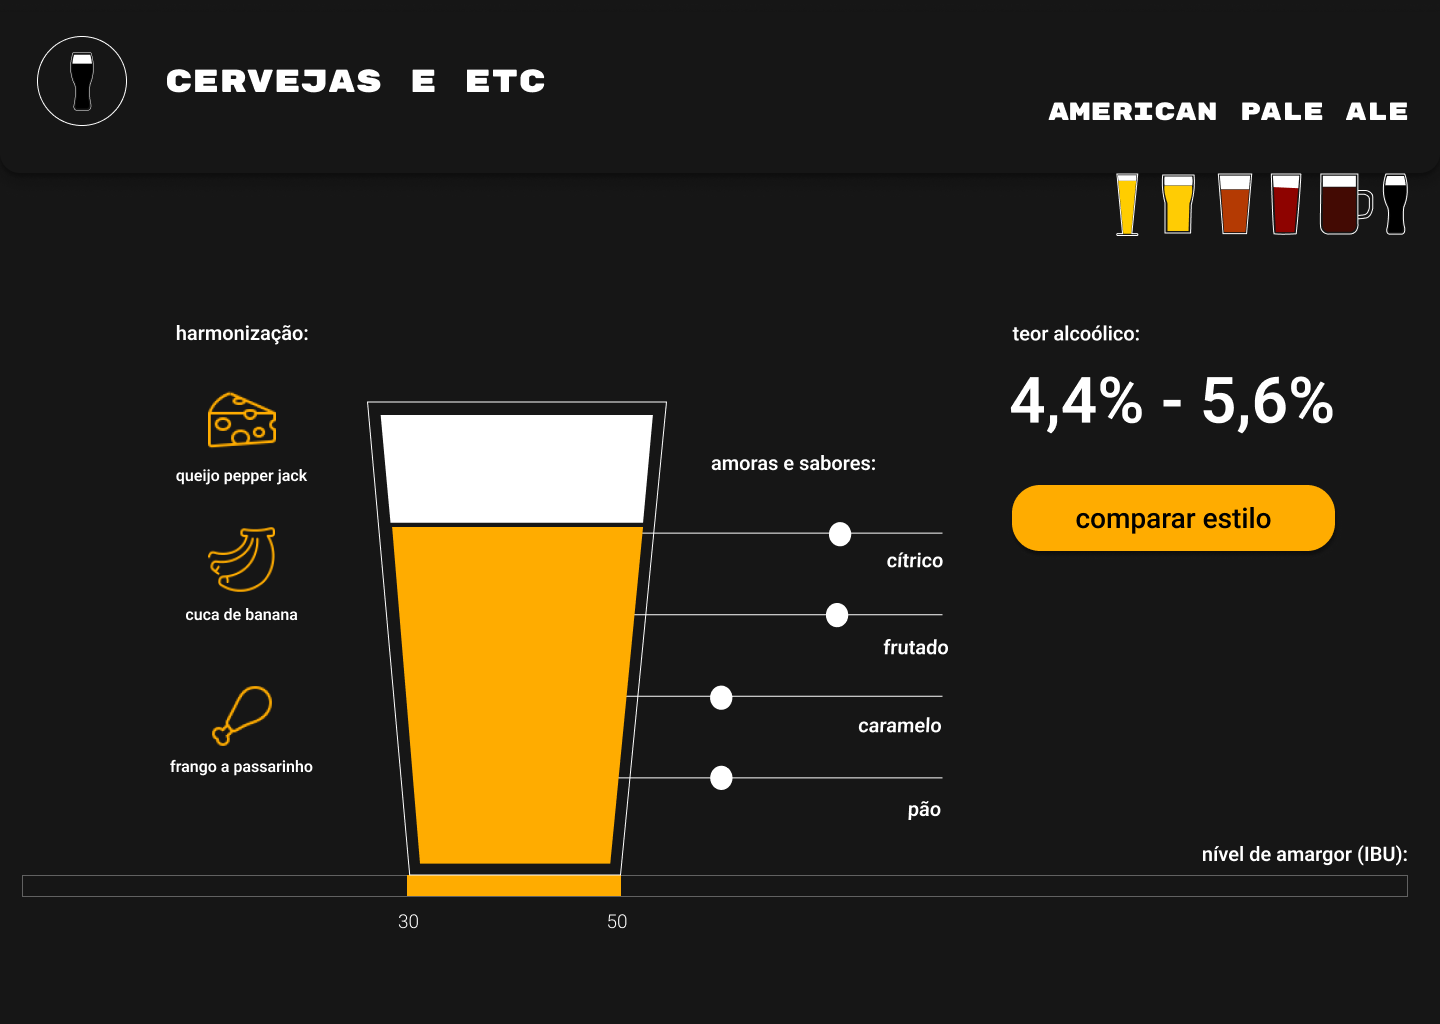
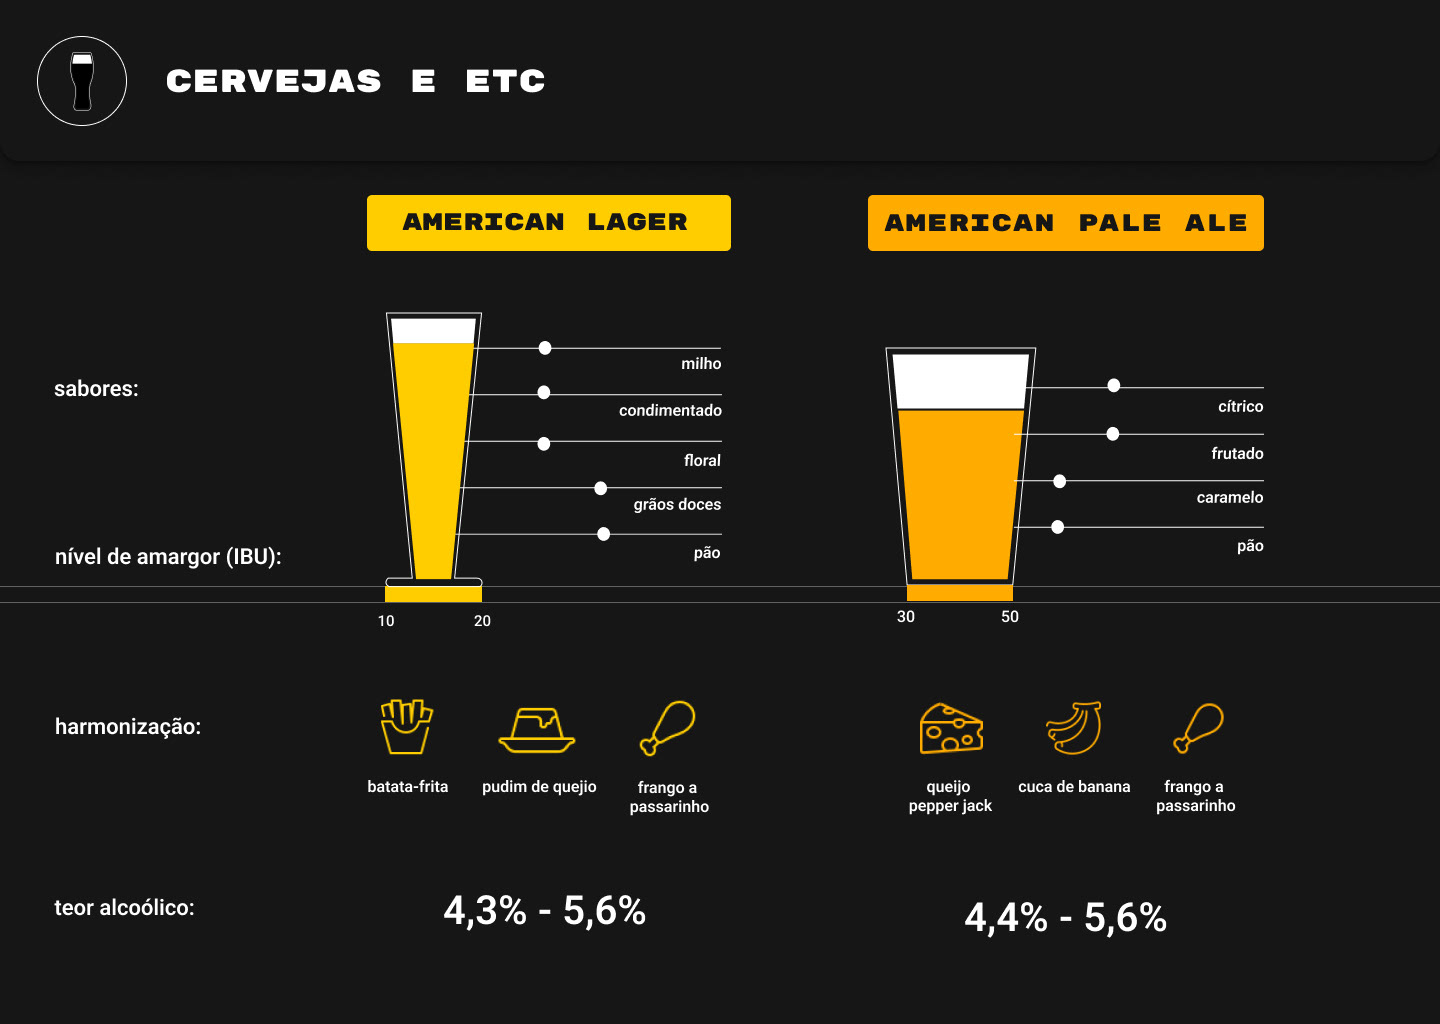
As cores das cervejas são elementos fundamentais de sua identidade, então incorporamos essa paleta ao sistema de cores do site. As ilustrações foram pensadas para solucionar o problema de representação das marcas. Já que optamos por fazer um site que explicasse sobre estilos que abrangem diferentes marcas, representamos as cervejas através dos copos ideais para cada estilo e a cor mais similar em nossa paleta.
Design System and Visual Identity
The colors of the beers are fundamental elements of their identity, so we incorporated this palette into the website's color system. The illustrations were designed to address the challenge of representing the brands. Since we opted to create a website that explains styles encompassing different brands, we represented the beers using the ideal glassware for each style and the closest color within our palette.
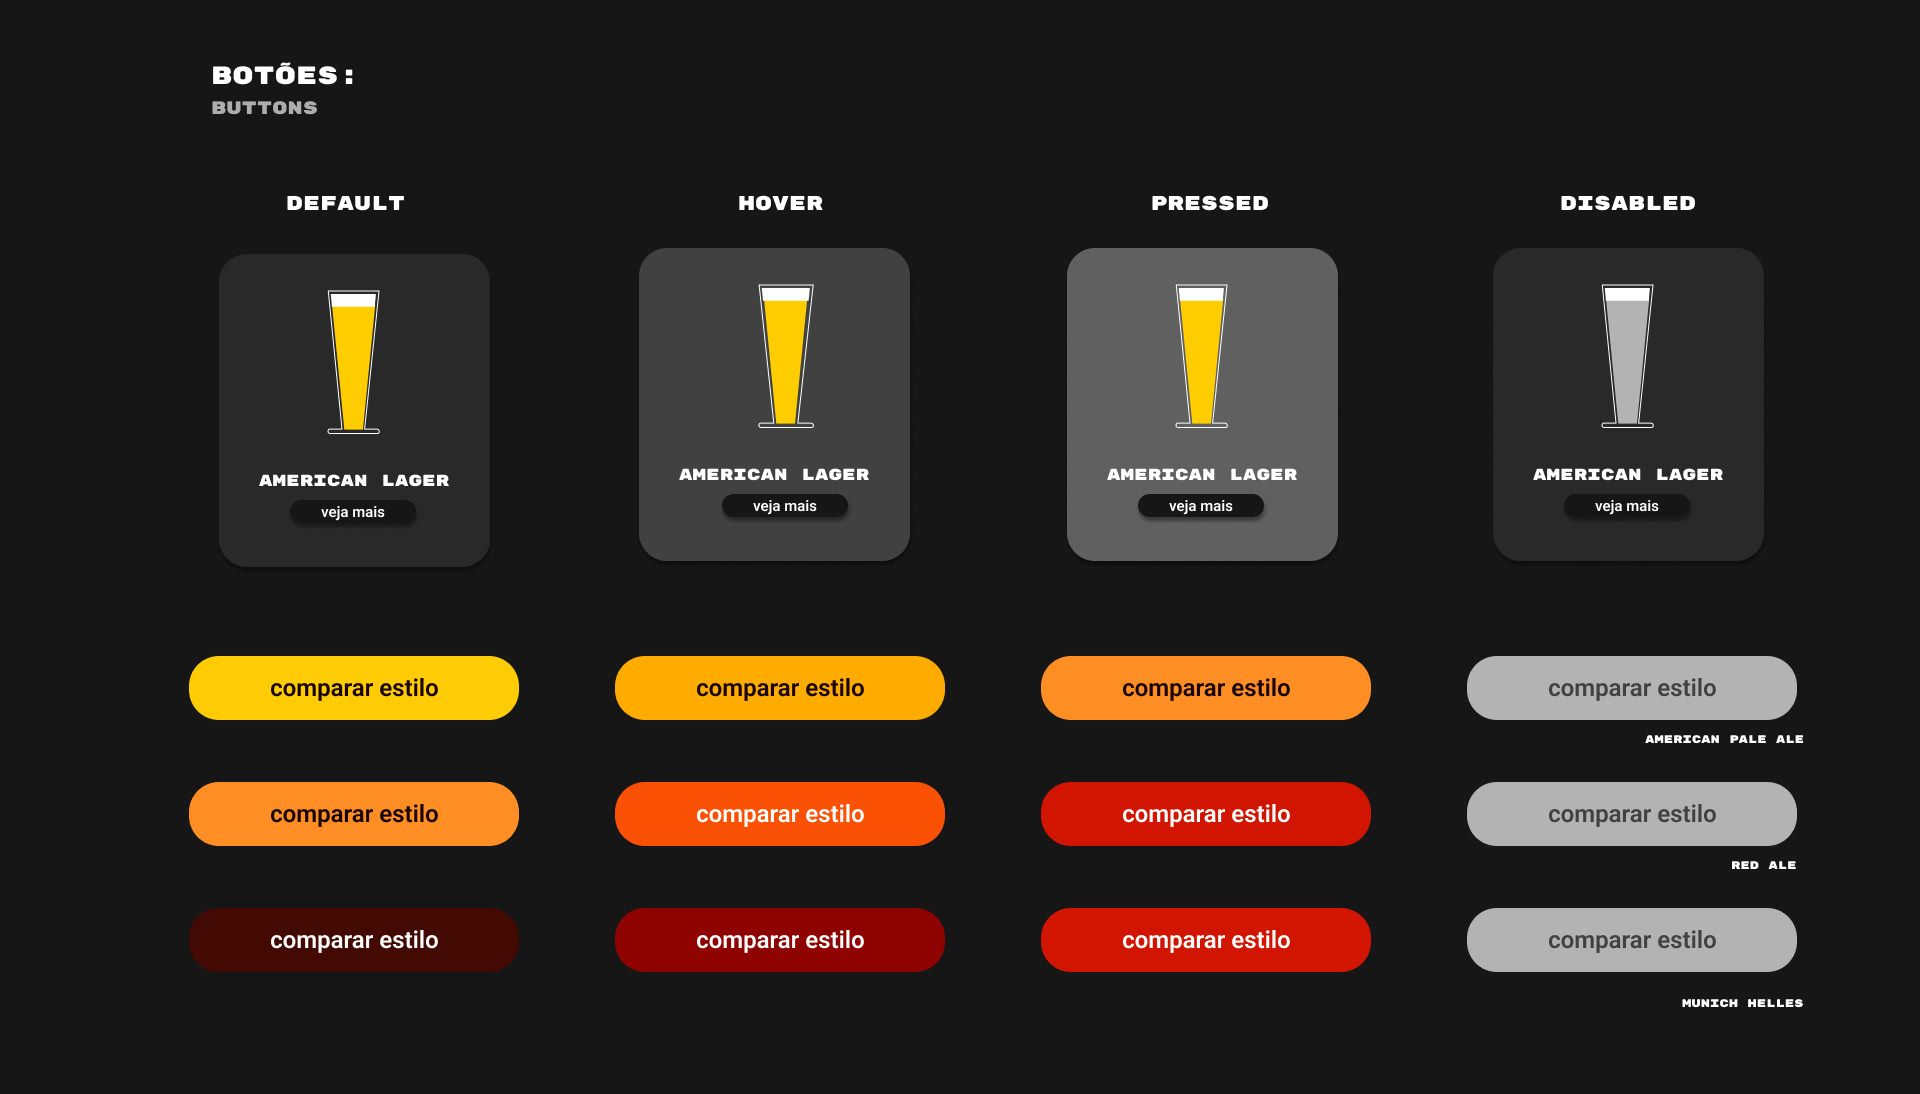
As cores dos botões foram pensadas para cada estilo de cerveja, começando pela representação da sua cor original e escurecendo ou clareando um tom da paleta conforme o estado do componente. Como referência, utilizamos o site
The button colors were designed to reflect the characteristics of each beer style, starting with the representation of their original color and adjusting the shade within the palette to indicate the component's state.We use as reference Material Design
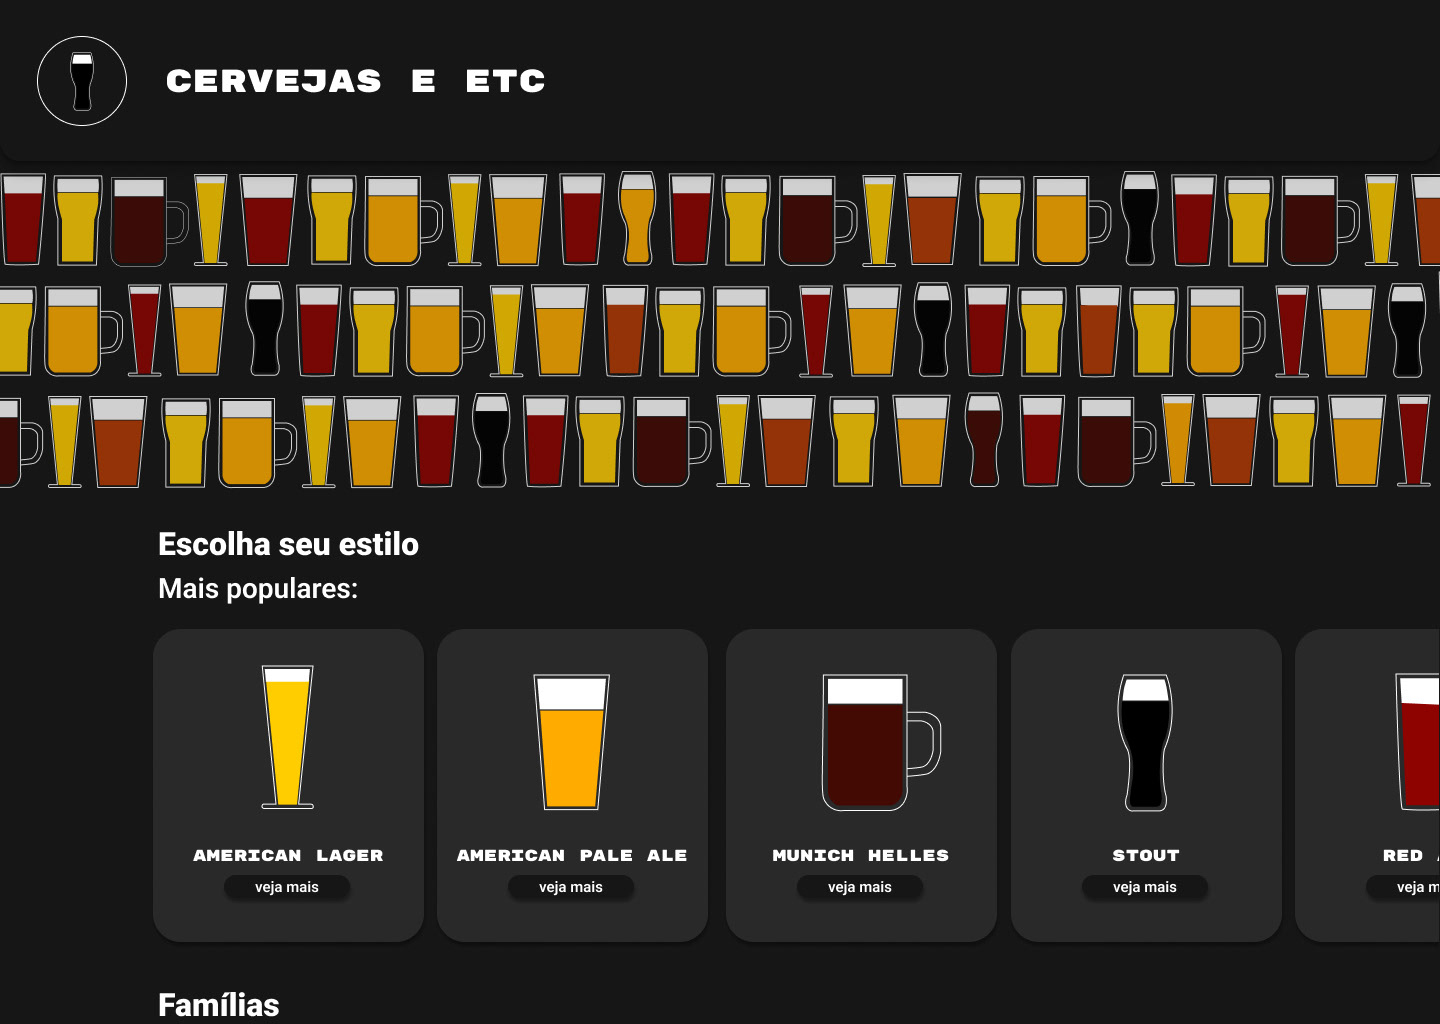
Protótipo Final:
Final Prototype
Referências:
- Storytelling com Dados, Cole Nussbaumer Knaflic
- Dear Data, Stefanie Posavec e Giorgia Lupi
- O livro da cerveja, Alexandre Lucas, Francesca Sanci e Renata Steffen
- Gramática visual, Christian Leborg
Desenvolvido na disciplina de Projeto de Interação 2 na ESDI, 2023.1
thank you for your attention :)